
Article Topics
Catching fraud with Benford’s Law in Excel
When you hear “forensic auditing,” you might picture some kind of detective movie, but the job is usually more about data than drama. These days, “following the money” means digging through thousands, or even millions, of digital transactions. The interesting part is that numbers tell a story, especially when someone is trying to hide something. Fake data just doesn’t look the same as real, organic data, and one of the best tools for telling them apart is a statistical trick called Benford’s Law.
Think of it this way: just like a water slide has a predictable curve, so do the first digits in most real-world datasets. This guide will show you what Benford’s Law is, explain why it’s so reliable, and walk you through how to use it in Microsoft Excel. We’re going to turn this cool theory into a hands-on tool that helps you spot suspicious numbers and focus your investigation right where it counts.
Understanding the basics
What exactly is Benford’s Law? At its heart, it’s a simple observation about how often certain numbers appear as the first digit in a set of data. You’d probably guess that the digits 1 through 9 would each show up about 11% of the time, right? It seems logical, but in most real-world data, that’s not the case at all.
What actually happens is that the number 1 is the first digit about 30.1% of the time. The number 2 shows up around 17.6% of the time, and the frequency keeps dropping for bigger digits, with 9 appearing less than 5% of the time. This isn’t a new idea; an astronomer named Simon Newcomb noticed it back in 1881, and a physicist, Frank Benford, confirmed it in 1938 using all sorts of data, from the area of rivers to population stats.
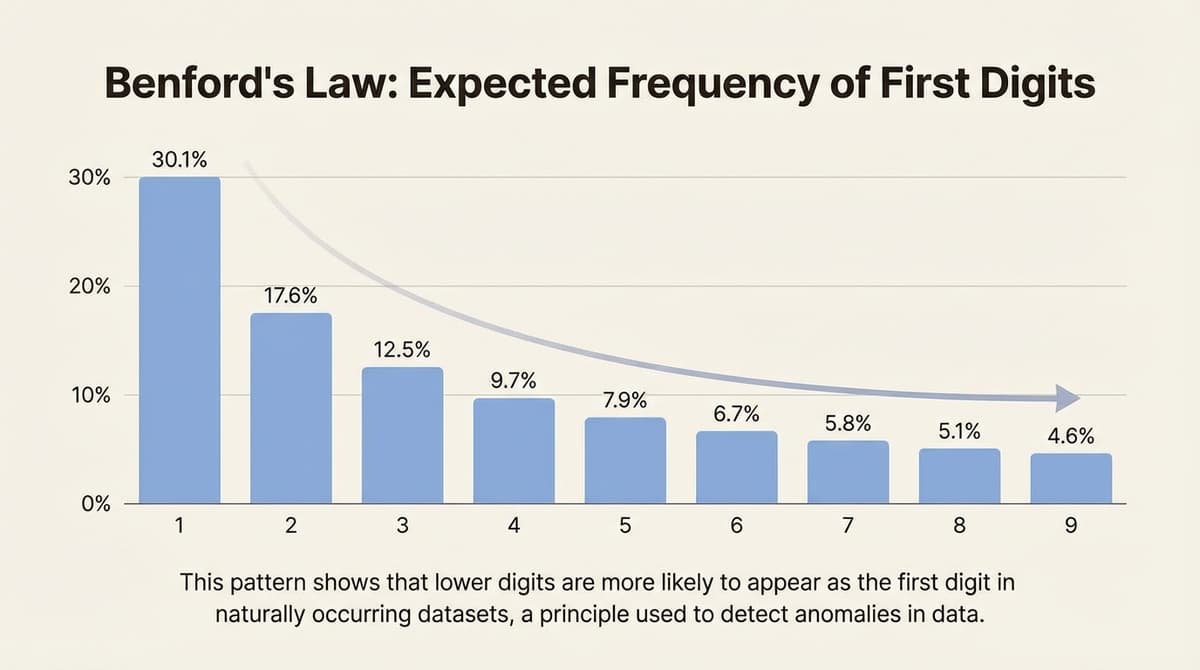
This phenomenon is particularly valuable for auditors because people who fabricate numbers for invoices or expense reports often fail to replicate this natural pattern. Their “random” numbers tend to be too evenly distributed, which makes them conspicuous when you run this analysis. It is more than a mathematical curiosity. When examining a general ledger with 50,000 entries, it is impossible to check every line. Benford’s Law acts as a filter that highlights unusual entries, helping you work more efficiently by letting the data guide your investigation.
The science of Benford’s Law
You might be wondering why this strange pattern even exists. It’s not magic; it’s all about math and logarithmic scales. To put it simply, a number “spends more time” with a lower first digit. For a value to go from $100 to $200, it has to increase by 100%. But to get from $900 to $1,000, it only needs an 11% bump before the first digit flips back to 1. Because of this, lower digits just have a higher chance of showing up first.
The official formula to calculate the probability for any digit d (from 1 to 9) is: P(d) = log10(1 + 1/d).
| Leading Digit | Expected Frequency (Benford’s Law) |
|---|---|
| 1 | 30.1% |
| 2 | 17.6% |
| 3 | 12.5% |
| 4 | 9.7% |
| 5 | 7.9% |
| 6 | 6.7% |
| 7 | 5.8% |
| 8 | 5.1% |
| 9 | 4.6% |
Knowing this is a huge advantage for an auditor. When someone fakes invoices, they often try to keep the amounts just below an approval limit, which can lead to a disproportionately high number of numbers starting with 4 or 9 (think amounts like $4,800 or $9,500). This kind of human bias is exactly what a Benford’s Law analysis is built to catch. It takes advantage of the fact that what people think is “random” rarely matches the natural patterns in real data.
When and where to apply
Benford’s Law is a fantastic first-pass tool, but you have to know when to use it. The law is most effective on naturally generated data that covers several orders of magnitude (for example, values in the tens, hundreds, and thousands).
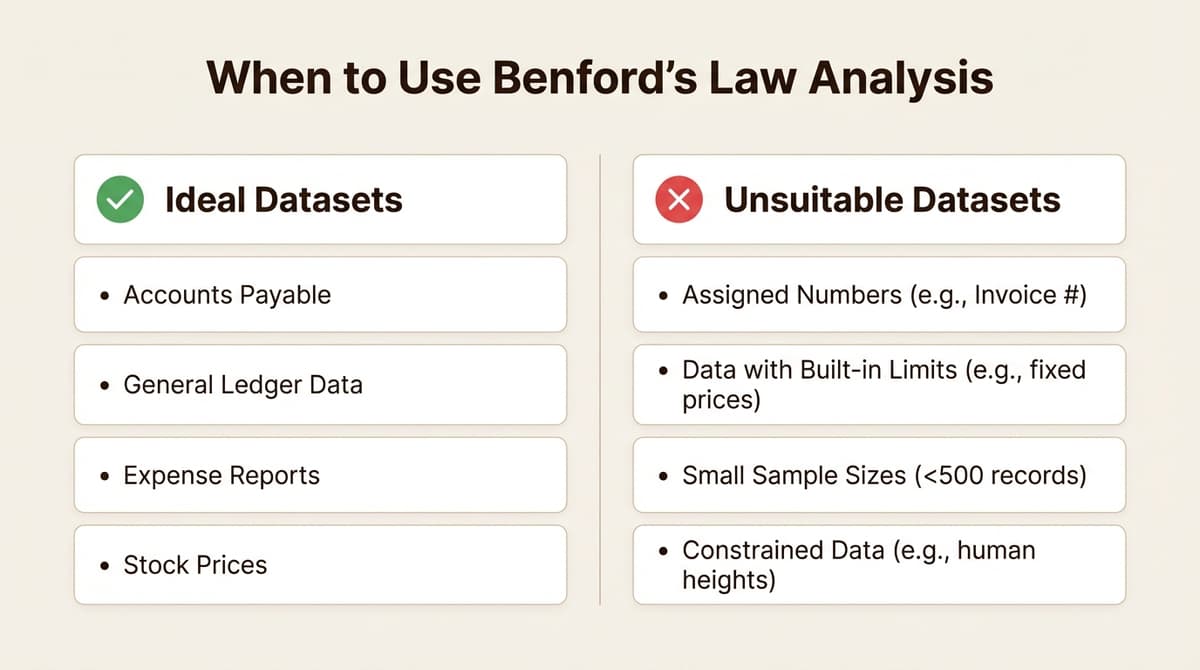
Suitable datasets for analysis:
- Accounts Payable: Checking vendor invoice amounts or payments is a perfect use case. If you see a sudden jump in invoices starting with ‘8’ or ‘9’, it could mean someone is trying to stay just under an approval threshold.
- General Ledger Data: Running a test on a complete list of journal entries can uncover odd patterns that might point to fraud or miscategorized transactions.
- Expense Reports: Employee expense claims are a classic area for manipulation. Finding deviations here can help you pinpoint people who might be submitting inflated or fake claims.
- Stock Prices & Population Numbers: These are classic examples often used to demonstrate the law because they follow the pattern so well.
Unsuitable datasets for analysis:
It’s equally important to know when not to use the law. Steer clear of datasets that have:
- Assigned Numbers: Things like check numbers, invoice numbers, or PO numbers are usually sequential and won’t follow the law.
- Built-in Constraints: Data with artificial limits will throw off the results. For instance, the heights of professional basketball players fall within a tight range, and a company that only sells items for $49.99 or $79.99 won’t produce conforming data.
- Small Sample Sizes: The law is much more reliable with bigger datasets. It can work with as few as 100 records, but it gets much more accurate with 500 or more.
- Certain Financial or Civic Data: Research has shown the law doesn’t work well for things like Bitcoin prices or election results, which are driven by different types of human behaviors and systems.
Applying Benford’s Law in Excel
You don’t need any fancy software for this. You can run a Benford’s Law in Excel analysis with the tools you already have. The whole process breaks down into three steps: pull out the first digit, count how often each one appears, and then compare your results to the expected pattern.
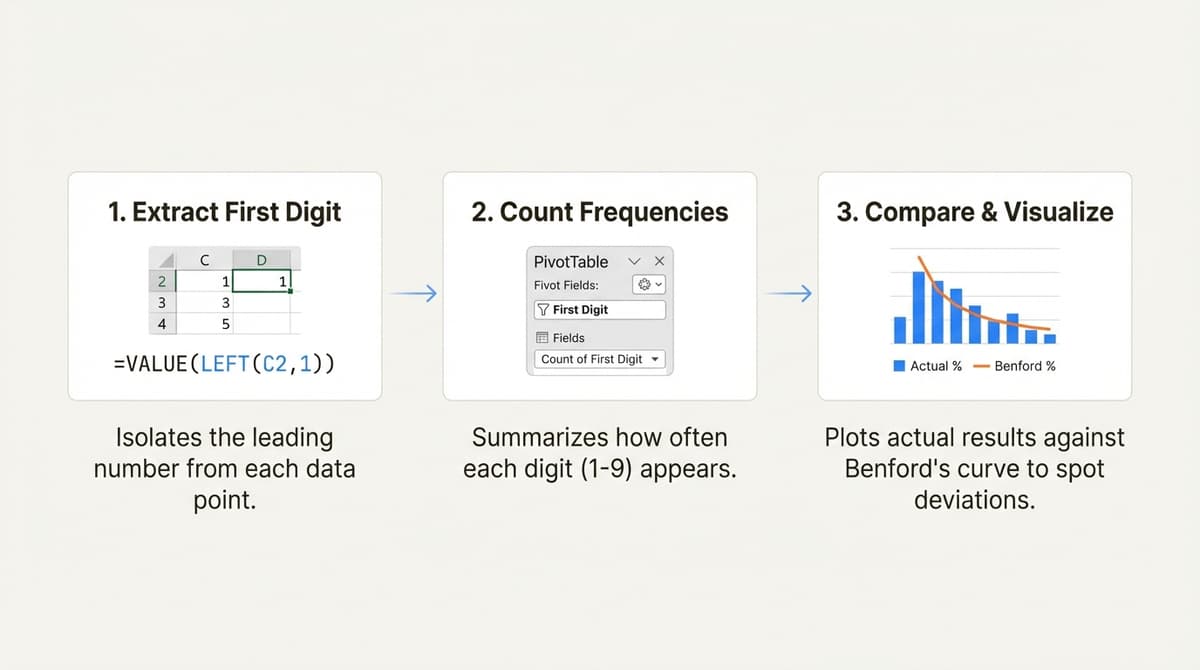
Let’s walk through an example using a made-up list of vendor payments.
1. Extract the first digit
First, you’ll need a new column to hold the first digit of each transaction. If your payment amounts are in column C, starting at cell C2, you can combine the LEFT and VALUE functions. The LEFT function grabs the character on the far left, and VALUE turns that text character back into a number so you can do calculations with it.
In a new column (we’ll use column D), type this formula into cell D2:
“=VALUE(LEFT(C2,1))”
Hit Enter, then grab the little square at the bottom-right corner of the cell and drag it down to apply the formula to all your transactions. Now you have a column filled with just the first digit of every payment.
2. Count the frequencies
Next, you need to count how many times each digit from 1 to 9 shows up in your new “First Digit” column. If you have a lot of data, a PivotTable is the fastest way to do this.
- Click anywhere in your data range.
- Go to the Insert tab and click PivotTable. Excel should automatically select your data. Just click OK.
- In the PivotTable Fields panel, drag your “First Digit” field to the Rows area. This will give you a list of the unique digits (1-9).
- Drag the “First Digit” field again, but this time drop it into the Values area. It should default to “Count of First Digit.” If it says “Sum,” just click on it, choose Value Field Settings, and switch it to Count.
- To see this as a percentage, right-click any value in the “Count” column of your PivotTable, go to Show Values As, and pick % of Grand Total. This will instantly show you the frequency distribution.
- You now have a neat summary table showing the actual percentage for each leading digit in your data.
3. Compare actual vs. expected results
The last step is to visualize your results to see how they compare to Benford’s Law. A combination chart is the best way to see your actual data against the expected distribution.
- Copy the results from your PivotTable into a new, simple table. Make three columns: “Digit” (1-9), “Actual %” (paste your percentages), and “Benford %” (type in the expected percentages from the table earlier).
- Select this new three-column table. Go to the Insert tab, click Recommended Charts, and pick the Clustered Column Chart.
- Once the chart is created, right-click on one of the bars for the “Benford %” series and click Change Series Chart Type.
- In the dialog box, find the “Benford %” series and change its chart type from a Clustered Column to a Line with Markers. Click OK.
Now you’ll have a chart with your data’s distribution as columns and the ideal Benford’s Law curve as a line laid over it. If a dataset follows the law, your blue bars will closely follow the orange line. Big differences, like a spike at ‘9’ for amounts just under a $10,000 approval limit, are your cue to start a deeper forensic investigation.
Benford’s Law doesn’t conform
If your chart shows some major deviations from the Benford curve, it’s time to dig deeper. A non-conforming result is not definitive proof of misconduct, but it is a significant indicator that calls for a methodical response. According to guidance from the Journal of Accountancy, here’s what forensic auditors should do next:
- Reconsider the data’s suitability: Before you conclude, pause and double-check if the dataset was a good fit for this test. Did you overlook a built-in bias, like a fixed price list or a government-mandated payment amount? If so, the strange results might just be part of the normal business process, not fraud.
- Apply analytical review procedures: As outlined in AU-C Section 520, you should look for more assurances. You could test a sample of the suspicious transactions by tracing them back to source documents like invoices, receipts, or contracts. You could also compare the data to previous periods to see if the deviation is a new thing.
- Rethink internal controls: A big anomaly might signal a weakness in internal controls. This is a chance to assess whether current processes are strong enough to prevent or catch issues. For example, if you see a spike in payments just below an approval threshold, it may be necessary to re-evaluate that threshold or tighten the approval process.
- Consider the source: Think about where the data came from. Was it generated internally, or did you get it from an outside party? If it’s an external dataset, you may need to ask them how they ensure their own data’s integrity.
Benford’s Law in modern auditing
Benford’s Law is much more than a statistical party trick; it’s a practical and powerful data analytics technique for any forensic auditor. It gives you a scientific way to find hidden red flags in huge datasets, turning the overwhelming task of finding a needle in a haystack into a focused, evidence-based hunt.
By using simple tools in Microsoft Excel, you can quickly check if a set of numbers looks natural or manipulated. While it won’t prove fraud by itself, it’s an essential tool for narrowing your focus and putting your energy toward the transactions that really matter. It helps you ask smarter questions and back up your professional skepticism with solid data.
Also read: 10 Internal audit KPIs to your value to the board
Frequently Asked Questions
Q1: What is the main purpose of using Benford’s Law in Excel for a forensic audit?
A: The main purpose is to act as a high-level screening tool. It helps auditors quickly identify anomalies in large datasets, like accounts payable or general ledgers, that might indicate fabricated numbers or fraud. It points you toward transactions that deserve a closer look.
Q2: Can I apply Benford’s Law in Excel to any dataset?
A: No, it’s not suitable for all data. It works best on naturally occurring numbers that span several orders of magnitude (e.g., 100s, 1000s, 10,000s). It shouldn’t be used on datasets with assigned numbers (like invoice numbers) or data with built-in limits (like fixed prices).
Q3: How many records do I need to effectively use Benford’s Law in Excel?
A: While the analysis can work with as few as 100 records, its reliability and accuracy improve with larger datasets. For best results, it’s recommended to use a dataset with 500 or more entries.
Q4: If my data fails a Benford’s Law in Excel test, does it automatically mean there’s fraud?
A: Not necessarily. A failed test is a strong red flag, but it isn’t definitive proof of fraud. It indicates that the data is anomalous and requires further investigation. The deviation could be due to a business process quirk or an error, so it’s a starting point for deeper analysis, not a final conclusion.
Q5: What are the key steps to perform a Benford’s Law in Excel analysis?
A: The process involves three main steps: 1) Extract the first digit of each number in your dataset using a formula. 2) Count the frequency of each digit (1-9), typically using a PivotTable. 3) Compare your actual frequencies to the expected Benford’s Law percentages, usually by creating a chart to visualize the differences.
